Dashboards
Built pricing and performance views using retail and household data.
Simply Good Foods
Los Angeles / Summer 2025
I built dashboards, synthesized consumer research and presented findings during my internship with the team behind Quest, Atkins and OWYN. My work connected retail and household data with questions about products, purchase behavior and brand strategy.
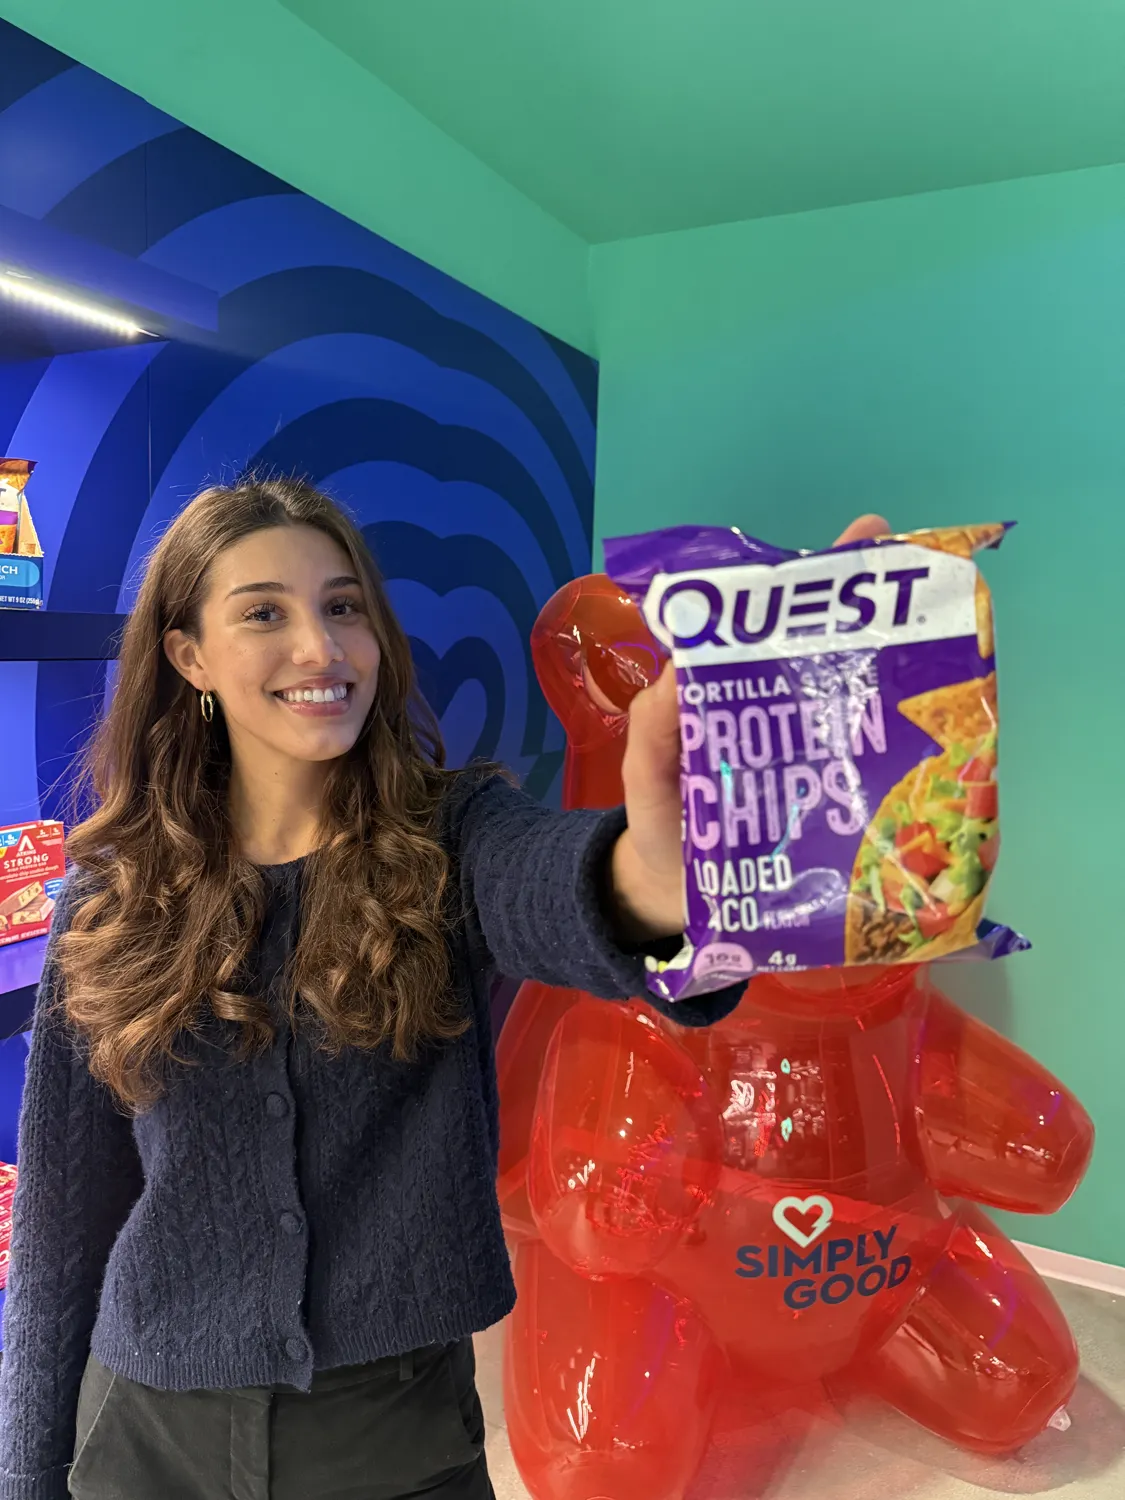 A summer in Los Angeles
My work at a glance
Built pricing and performance views using retail and household data.
Wrote survey questions and presented consumer findings to brand leadership.
Reviewed classifications and duplicate product codes before interpreting comparisons.
The assignment
I worked with consumer feedback, retail reports and household purchase data to support the strategy and insights team. I organized the analysis around the question at hand, whether that meant comparing performance, checking data quality or explaining what consumers said.
The summaries below describe my contributions. Internal findings, figures and product concepts remain confidential.
Selected contributions
Each assignment called for a different kind of thinking: asking better questions, comparing the right measures, checking the source, or making a recommendation clear.
Consumer insights
I synthesized consumer responses to explain product perceptions, purchase drivers and questions for further research.
I organized consumer feedback into a clearer explanation of purchase drivers, perceptions, and questions for further evaluation.
Work produced: survey questions, research synthesis, and a leadership presentation.
Retail & household data
I built views that brought pricing, category performance, and household purchase behavior into a more usable format.
I condensed multiple reports into organized views that supported category planning and leadership discussions.
Work produced: pricing analysis, category summaries, and performance dashboards.
Data integrity
Comparisons depend on how products are grouped and counted. I examined those details as part of my analysis.
I made potential reporting issues easier to trace, giving the team a clearer basis for checking comparisons before using them.
Work produced: a data audit and an organized record of items needing review.
Research translation
I translated category research and industry information into materials for strategy and nutrition leadership audiences.
I brought dispersed information into a shared reference and made the most relevant points easier to find and discuss.
Work produced: category education slides, an industry readout, and a tailored brief.
Digital & brand strategy
I explored digital commerce and brand collaboration through research, competitive examples, and audience fit.
I gave the team a structured set of examples and reasoning to consider in future marketing discussions.
Work produced: competitive research and strategy presentations. Concepts remained proposals, not partnerships I launched.
How I approached the work
Clarify what the team needs to understand and which audience will use the work.
Work with the relevant reports or consumer responses and organize the comparison.
Look at product groupings, time periods, and data limitations before interpreting a pattern.
Turn findings into a presentation that connects the evidence to a business question.
The creative side
I also partnered with the social media manager on a Quest intern takeover, helping plan and film short videos for TikTok and Instagram Reels.
That work let me contribute in a different way: move from analyzing a brand’s audience to creating content for it.
What I brought to the team
I built dashboards and presentations that organized complex research around a question.
I checked classifications and measurement limits instead of treating every reported figure as ready to use.
I brought consumer research, market context, and creative thinking into the same conversation.