J677 · DATA ANALYSIS & VISUALIZATION · MAY 2026

Who’s leaving
Spotify?

We analyzed 8,000 simulated listener records to identify where churn differed, then translated the findings into priorities for further customer research.

Exploratory Data Analysis + Data StorytellingR + tidyverseCustomer SegementationProduct Analytics

WHAT THE WORK ACCOMPLISHED

Turned a broad retention question
into a focused research direction.

Our comparisons shifted attention from listening behavior to subscription plans and markets. We delivered a research poster, an infographic, and an executive brief that explained the patterns, their limits, and what to investigate next.

Outcome: An exploratory analysis and stakeholder communication package that identified high variance user segments and framed targeted hypotheses for customer research.

01 / THE ASSIGNMENT

Defining the questions
behind subscriber churn.

This project connects statistical programming in R with business communication. Working across eight thousand subscriber records, our team audited data distributions, evaluated behavioral metrics, and translated findings into multi format deliverables for cross functional decision makers.

My role: Conducted exploratory data analysis in R, collaborated on writing tidyverse wrangling scripts, collaborated on designing the infographic layout, and co authored the executive brief.

02 / THE PROCESS

How we approached the data.

01

Documented what the data could answer.

We audited the eight thousand record dataset by evaluating variable types, distributions, and schema completeness to verify data hygiene prior to exploratory analysis.

Why it mattered Defining the churn outcome and the source prevented us from treating simulated records as verified customer behavior.

Data evaluation
02

Prepared consistent groups in R.

Using tidyverse in R, we structured the data pipeline by converting categorical variables into factors, recoding status values, and standardizing group structures for reproducible summaries.

Why it mattered Structured data wrangling established clean schemas, enabling reliable segment aggregations and readable chart labels.

R + tidyverse
03

Compared segments instead of stopping at an average.

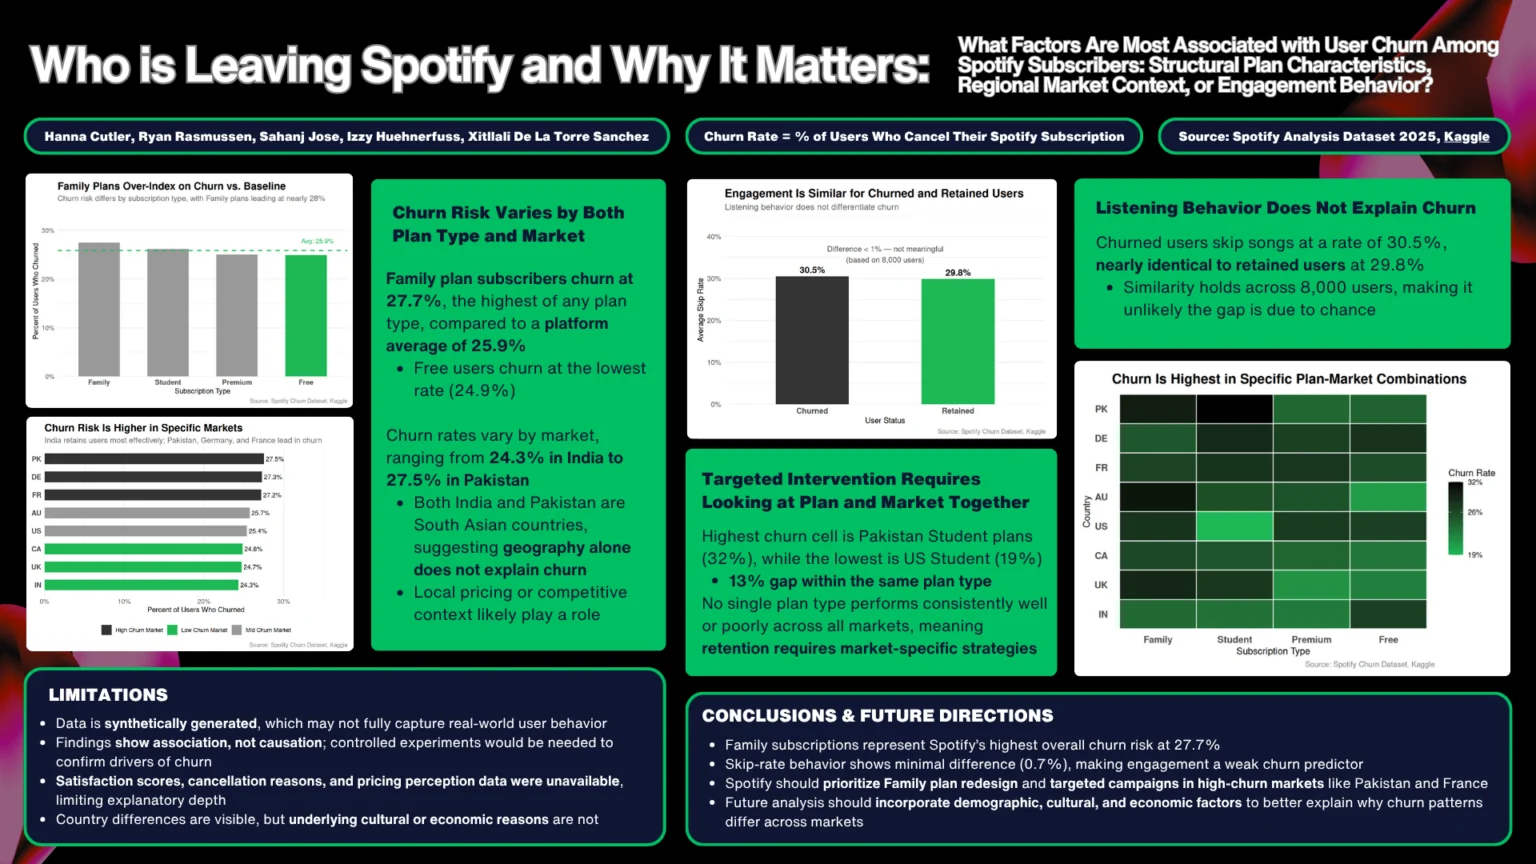
We calculated churn percentages by plan, country, and their combinations. We also compared listening behavior between retained and churned users and grouped markets relative to overall churn.

Why it mattered Segment comparisons revealed variation that the overall 25.9% churn rate could not explain on its own.

Descriptive analysis
04

Made the comparisons readable.

We used bar charts for direct comparisons and a heatmap to show 32 plan and market combinations. Short annotations stated the takeaway; consistent green accents guided attention.

Why it mattered Readers could compare values and understand the finding without first interpreting a dense table.

Visual communication
05

Turned findings into questions a team could pursue.

We translated quantitative findings into tailored deliverables for diverse audiences, producing an executive brief for leadership, an infographic for quick alignment, and a technical research poster. Recommendations established clear priorities around Family tier pricing perceptions, localized churn drivers, and exit survey design.

Why it mattered The deliverables connected evidence to next steps while keeping association separate from causation.

Research synthesis

03 / THE FINDINGS

Where churn separated, and where it did not.

Explore three comparisons from the team’s analysis. Each pairs a finding with its practical meaning.

Average skip rate

Listening behavior showed little separation.

Churned users30.5%
Retained users29.8%

WHAT WE FOUND

Average skip rates differed by just 0.7 percentage points.

WHY IT MATTERS

Audio engagement metrics such as skip rate showed virtually no correlation with churn in this dataset. Disproving that initial assumption helped pivot team focus away from in app listening features toward structural pricing and regional factors.

Churn rate by subscription

Family plans sat above the overall average.

Family27.7%
Overall25.9%
Free24.9%

WHAT WE FOUND

Family plan churn was 27.7%, compared with 25.9% overall and 24.9% for Free users.

WHY IT MATTERS

We recommended asking former Family plan users about value and their reasons for leaving. The comparison identifies a research priority, not a cause.

Student plan churn by market

Same plan. 13 percentage points apart.

Pakistan / Student32%
United States / Student19%

WHAT WE FOUND

Student plan churn was 32% in Pakistan and 19% in the United States.

WHY IT MATTERS

A single plan average can hide market differences. We recommended local research before developing targeted retention tests.

Source: team executive brief and research poster. Synthetic data. Shared 0 to 40% scale. Rounded values; descriptive comparisons.

See the original research poster +

The original team deliverable brings the full set of comparisons together.

Original team research poster showing churn by subscription, country, listening behavior, and combined plan and market segments.

Open the poster to inspect the full size image.

04 / WHAT I LEARNED

Numbers reveal patterns,
but context drives action.

This project taught me that data visualization is only half the job; the real work is translating quantitative patterns into a clear direction for stakeholders.

I learned that disproving an intuitive hypothesis is just as valuable as confirming one. Identifying near zero separation in skip rates prevented unwarranted focus on listening habits and redirected our analytical attention toward commercial plan structures.

I learned how to identify data blind spots and define future research requirements. Because the dataset lacked exit feedback and price sensitivity metrics, our final deliverable detailed the exact tracking instrumentation and qualitative surveys needed for the next iteration.

What the analysis can support

This exploratory study establishes meaningful baseline patterns and focused hypotheses. While synthetic data cannot prove causality or validate predictive models, it provides the quantitative rationale needed to guide qualitative customer research and design targeted AB tests.

Team project
Hanna Cutler, Ryan Rasmussen, Sahanj Jose, Isabella (Izzy) Huehnerfuss, and Xitllali De La Torre Sanchez.

Original sticker artwork
Xitllali De La Torre Sanchez.

Materials
Dataset documentation, executive brief, research poster, and infographic. J677, May 2026.

Independent student work using the Spotify Churn Analysis Dataset 2025 from Kaggle. Not commissioned by Spotify.